July through December 2018 – Aircraft Market Events
(the second half of 2018)
A few Surprises
The second half of 2018 in pictures.
The market trend was mixed (as indicated by the trend lines) along the major metrics.
Aircraft For Sale is increasing at a pace faster than aircraft are selling.
Aircraft Sold – Last 6 months of 2018
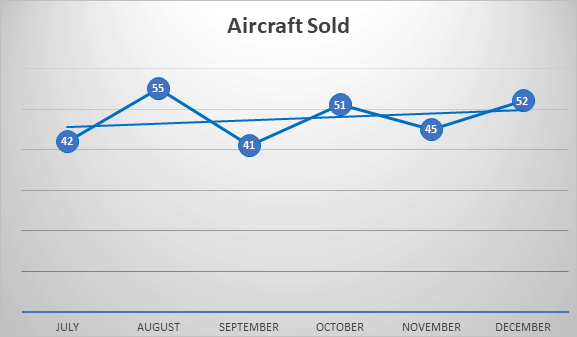
Average = 50 per month. July through December 2018
Average = 50 per month for all of 2018.
Average = 47 per month for all of 2017.
Aircraft For Sale – Last 6 months of 2018
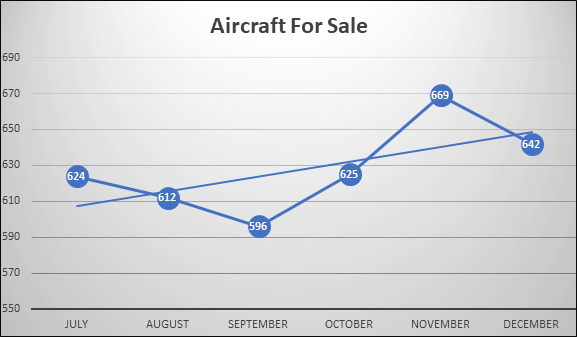
Average = 642 per month.
November and December were a surprise.
Inventory has been decreasing quarterly the past 10 quarters – this is the first uptick.
Will watch this trend closely.
Number of Months Supply:
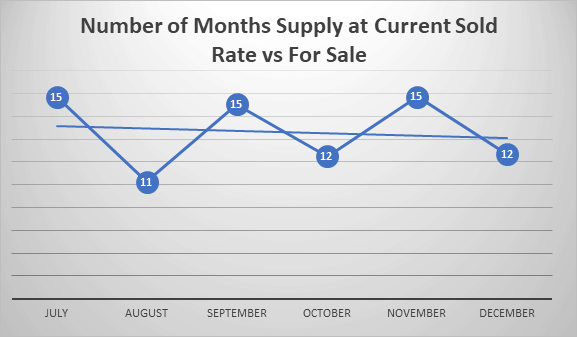
Average = 13 months.
We will watch this trend closely with the increase in the number of aircraft added to the market not being matched by increased sales activities.
Data without insight, often is useless.
For additional insight regarding this data or if you are interested in receiving specific aircraft market data, contact me.
Gene Clow
Great Circle Aircraft
(425) 822-7876
Proven Performance
Proven Experience
*For aircraft that have been in production sometime during the past 20 years.